

At TripleWhale, we believe (and the data shows) that there are better ways to assess channel and ecosystem health than the measurements you’re used to seeing.
We have identified three North Star metrics for the highest fidelity representation of a marketing ecosystem's health. Let's jump in.
⚰️ Blended ROAS is Dead
For the longest time, the gold standard for media buying was a blended metric. In other words, you would combine all of your efforts to establish your CAC or Customer Acquisition Cost.

With this model, if you’re running multiple channels — say Facebook, Google, and Snapchat — you would add up the total revenue from all of your paid channels and divide that by the total ad spend from those channels.
Blended ROAS = Total Paid Revenue / Total Ad Spend
Now, don’t get me wrong, I used to use blended, and report on blended. This was helpful when attribution had a semblance of efficacy.
However, the variations in reporting are so large now that the metrics are causing a misdiagnosis of true channel health. This leads to inefficient spend deployment and degrades performance throughout the ecosystem.
The central thesis of ‘3 ROAS to Rule Them All’ is that attribution is and always will be broken! Therefore we need channel-agnostic heuristics tied to a business objective to represent the health of our marketing ecosystem.
🆕 New Paradigm v Old Paradigm
At the highest level, business owners care about three things:
- Total Revenue
- Net Profit
- Net Margin
Side note: Net Profit and Net Margin are essentially the same things. The only real difference is that one is expressed as a percentage of total revenues (NM) and the other an absolute (NP).
Now, these are fantastic metrics, but they don’t give you any insights into your paid media’s efficiency, effectiveness, or profitability. As media buyers, this is what we care about.
Efficiency, Effectiveness, and Profit
Yes, you should care about Total Revenue, Net Profit, and Net Margin. But they aren’t high fidelity enough for you to make buying decisions.
That being said, let’s look at the old growth paradigm. It’s still a strong and useful framework, but like all frameworks, it has its drawbacks.
eCommerce Success = Traffic * Conversion Rate * Customer Value
Side note: Customer value manifests in AOV or LTV.
To be fair, this growth formula isn’t technically wrong. On the other hand, if I gave you those three metrics with MoM, QoQ, and YoY, deltas could you tell me:
- Short Term Health of the Business
- Long Term Health of the Business
- Profitability of the Business
You could definitely derive the short-term health of the business from the old growth formula, but would you know how efficient your paid media is? Or how profitable?
What about if you want to know the composition of the traffic? Is it just a bunch of super fans coming back, traffic from a bot farm in Russia, or actual new customers?
That was the exact impetus for us to develop a new way to look at the health of a marketing ecosystem. On top of that, these metrics combined with the OG metrics mentioned above (Total Revs, Net Profit/Net Margin) provide an accurate and comprehensive representation of a business’s health.
After going through inordinate amounts of data from a panoply of Shopify stores and millions of dollars of ad spend, we have identified a new growth formula:
eCommerce Success = ncROAS * eROAS * POAS
If you haven’t seen those acronyms before, they stand for new customer ROAS (ncROAS), ecosystem ROAS (eROAS), and profit on ad spend (POAS).
Let’s take a look at each one, starting with...
1. eROAS - Ecosystem ROAS
eROAS = Total Revenue/Total Ad Spend
Ecosystem ROAS, or eROAS, is a leading indicator of how effective your marketing ecosystem is.
eROAS is a great metric to buy off of and pace from. For example, a client might say they need a 3.5 ROAS to break even on Facebook and a 5 ROAS on Google.
That’s great, but that is predicated on the fact that channel attribution is 1) reliable and 2) accurate. Both of which are incredibly flimsy assumptions to base your paid media deployment on.
With eROAS, however, you can just ask your accountant or CFO how much money you can spend at X revenue.
Let’s make the math easy and assume that they say you can spend up to $100k a month with a minimum of $500k in revenue.
And just like that, we know our eROAS target.
eROAS = Total Rev/Total Ad Spend = 500k/100k = 5
With eROAS, you can derive an optimal pacing strategy for your spend. In this example, whenever your eROAS is below 5 you are overspent, and above 5 you are underspent.
Now you can confidently tell your client to spend more or less based on eROAS because it is tied to a business objective (in this case, the increase of total revenues) measured by…well, revenues. That’s why it works so well as a measure of marketing ecosystem effectiveness.
TL;DR: Ecosystem ROAS is a channel-agnostic heuristic to understand the effectiveness of your marketing efforts on revenue.
**Side Note: Some people refer to this as MER - Marketing Efficiency Ratio. I don’t necessarily hate the name, but found when explaining the same concept using eROAS, clients were way more receptive to the idea of a new “ROAS”.
2. ncROAS - New Customer ROAS
ncROAS = Total New Customer Revenue/Total Ad Spend
ncROAS, or New Customer ROAS, is a leading indicator of how efficient your marketing ecosystem is at generating accretive revenue, as opposed to reactivating returning customers.
Everyone talks about their new customer split. For example, you might have 60% returning customers and 40% new customers.
That 60/40 split may be ideal, but it’s not enough. You need to know how much that new customer and returning customer spent in relation to how much was spent to activate them.
Ultimately, the majority of your paid media budget should be spent on prospecting and bringing new blood into the fold.
ncROAS is a canary in the coal mine for long-term business health. If this metric starts to degrade or drop below 1, you know that you are losing money on the first customer activation.
If you are only looking at eROAS or POAS and you are successfully activating returning customers, those metrics would look healthy.
The long-term success of the business would be in peril, however, because of the lack of accretive revenue being generated by ads.
Another way to say this is: you are showing ads to people who are already going to convert, which means you’re deploying your spend inefficiently.
TL;DR: ncROAS is the harbinger for what’s to come in the next cycle of the business. It helps measure the efficiency of your marketing ecosystem. If this metric degrades, you might enjoy a lot of short-term success, but you will have severe long-term headwinds.
3. POAS - Profit on Ad Spend
Profit on Ad Spend or POAS is a leading indicator of the profitability of the current marketing efforts. This is ultimately the contribution margin, but CMOAS doesn’t really roll off the tongue.
On the other hand, contribution margin is a measure of profit. Hence, we don’t feel that guilty calling it POAS 🙂
POAS = Gross Profit/Total Ad Spend
We use Gross Profit because Operating Profit & Net Profit have line items that the media buyer can rarely impact. That said, the business could be wildly inefficient at the operating level. That operating inefficiency would not show up in Gross Profit or POAS.
Therefore, you should always track Net Profit and Net Margin to ensure you aren’t losing all your Gross Profit at other levels on the P/L.
On the other hand, if the business is simple enough or you have a partnership style relationship where you are “consulting”, you can ratchet all the way down to net profit and run POAS with the numerator being Net Profit.
This allows you to derive X amount of ad spend is driving Y amount of net profit. Don’t be afraid to ride the lightning ⚡!
TL;DR: POAS is a high-fidelity proxy for how profitable your ad spend is. POAS provides the answer to the question: Are you putting money behind the right products or services?
Not Every Dollar is Created Equal
Alright now let’s go through some data to show you what true pain looks like when you buy off the wrong metrics.
Below is data from a ~$1mm a year run rate store on Shopify.
First, let’s look at this business through the lens of the old growth formula of Traffic * CVR * Customer Value.
Old Growth Formula
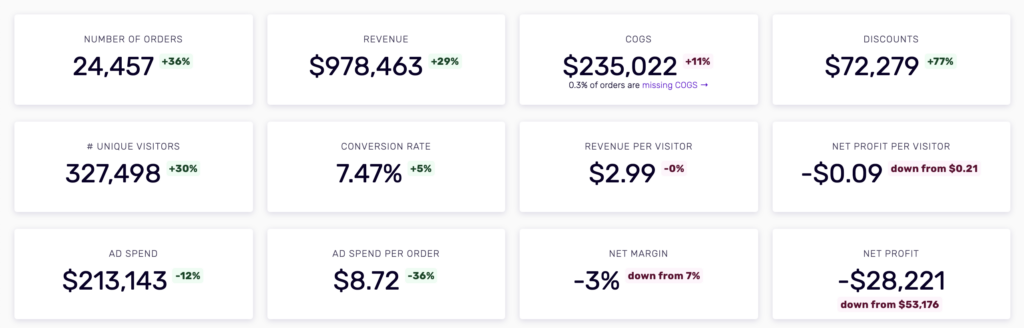
- Traffic +30 YoY — very nice!
- CVR + 5% YoY — strong
- AOV was -6% YoY and LTV was -5% YoY (not shown). Not horrible and definitely not red alert territory
If you looked at this business through the old growth paradigm, it is in a decent/great spot. But when you look at the blended data (not shown) it looks fantastic.
Revenue for the business had a healthy growth rate of +29% YoY. And ad spend was down -12% YoY. Again, nice, right?
But what were the net profits? $-28k. In a word, brutal.
What happened? People chose the wrong metrics as representations of the business health. Therefore, the spend kept coming. Said a different way: how many $20 bills can you sell for $10?
To exacerbate the issue, the business was being charged according to a percentage of spend, which further reduced net profits by increasing the operational expenses.
In addition, all the spend was behind the lowest margin products. To put it another way, they got really good at getting people to buy the least profitable products and then scaled that model.
This is not the way.
But this is what can happen if you don’t track your POAS. You will be printing money, only to realize at the end of the year you sold $1MM in product, but lost almost $30k?!
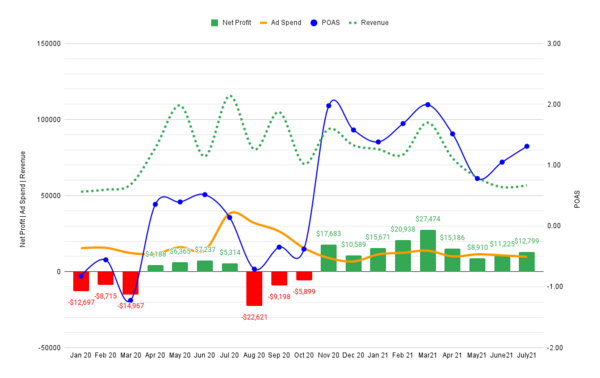
Can you spot on the graph where the optimization was switched to POAS?
Once POAS was introduced as the North Star Metric, profitability exploded. The business started printing money, even at lower levels of revenue because the business’s health is being evaluated using eROAS, POAS, ncROAS, Total Revs, and Net Profits, rather than Traffic, Customer Value, Conversion Rate, and Total Revenue.
Use the Right ROAS Metrics to Understand Your Ecosystem
Understanding which metrics give the most accurate representation of your ecosystem’s health is what will set you apart as a media buyer. We believe the highest-fidelity indicators for a marketing ecosystem’s health are:
- eROAS: Short term health of the business. How effective is my paid media?
- ncROAS: Long term health of the business. How efficient is my paid media? Am I bringing in new people or just reactivating past customers?
- POAS: Profitability of the marketing ecosystem. Am I promoting the right products to drive profits?
Also, the highest-fidelity indicators for business health are Total Revenues & Net Profit or Net Margin.
In summary, you should be tracking all six of these metrics to ensure you aren’t just looking at the health of the marketing ecosystem, but rather the business health, as a whole.
“Ok, I'm in. Now what? Do I need a plugin or app or something?” Nope. Not to worry, Triple Whale has you covered.
eROAS, ncROAS, and POAS are being built in Triple Whale as we speak. Soon you will be able to just add them to your dashboard and start printing money.


Related Posts:

 in 30 Days")