

The Covid-19 pandemic has impacted industries and economies around the world. Changes in Google Ads spending trends in 2020, both ongoing and in comparison to last year, are important for ad buyers, eCommerce sellers, and entrepreneurs looking to learn from and leverage these fluctuations.
After last month’s analysis, we have some updated Spend numbers as well as Clicks and Impressions data for more than 20 industries.
Google Ads Spending Trends Year-Over-Year
Graph 1 shows the mean year-over-year percentage change in spending from 2019 to 2020.
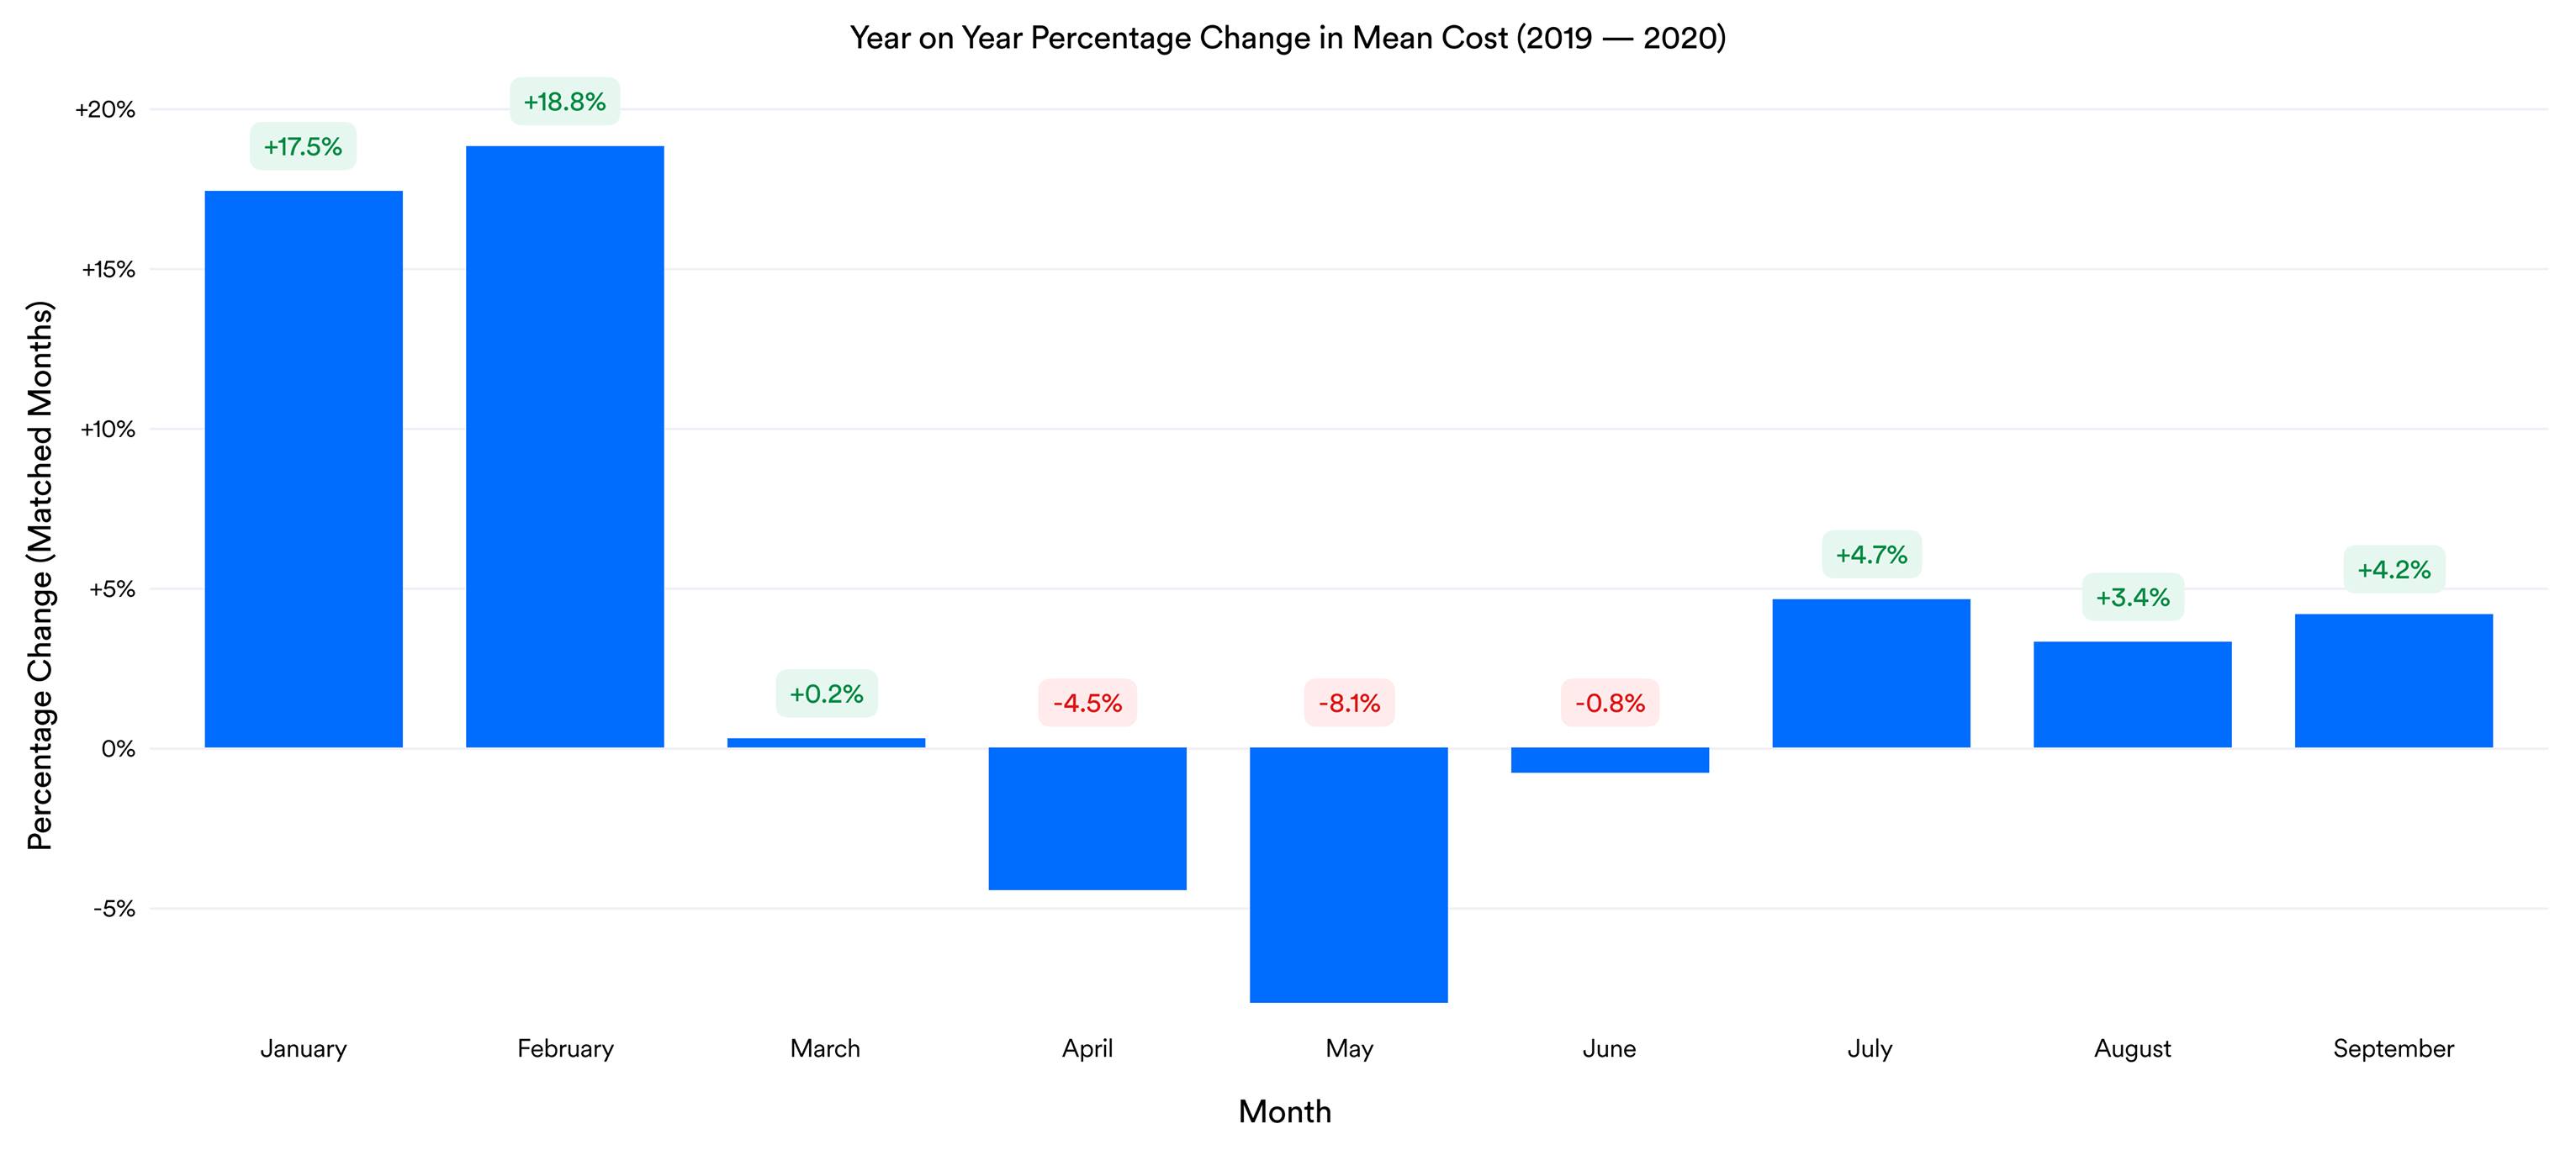
You can see that April through to June 2020 spend was down compared to the same period in 2019 (by around 10%). But by July 2020 spend started to recover.
Impressions and clicks, however, remained fairly strong. These metrics increased in nearly every month of 2019.
Graph 2 looks at the same time period and metrics but considers the median percentage change.
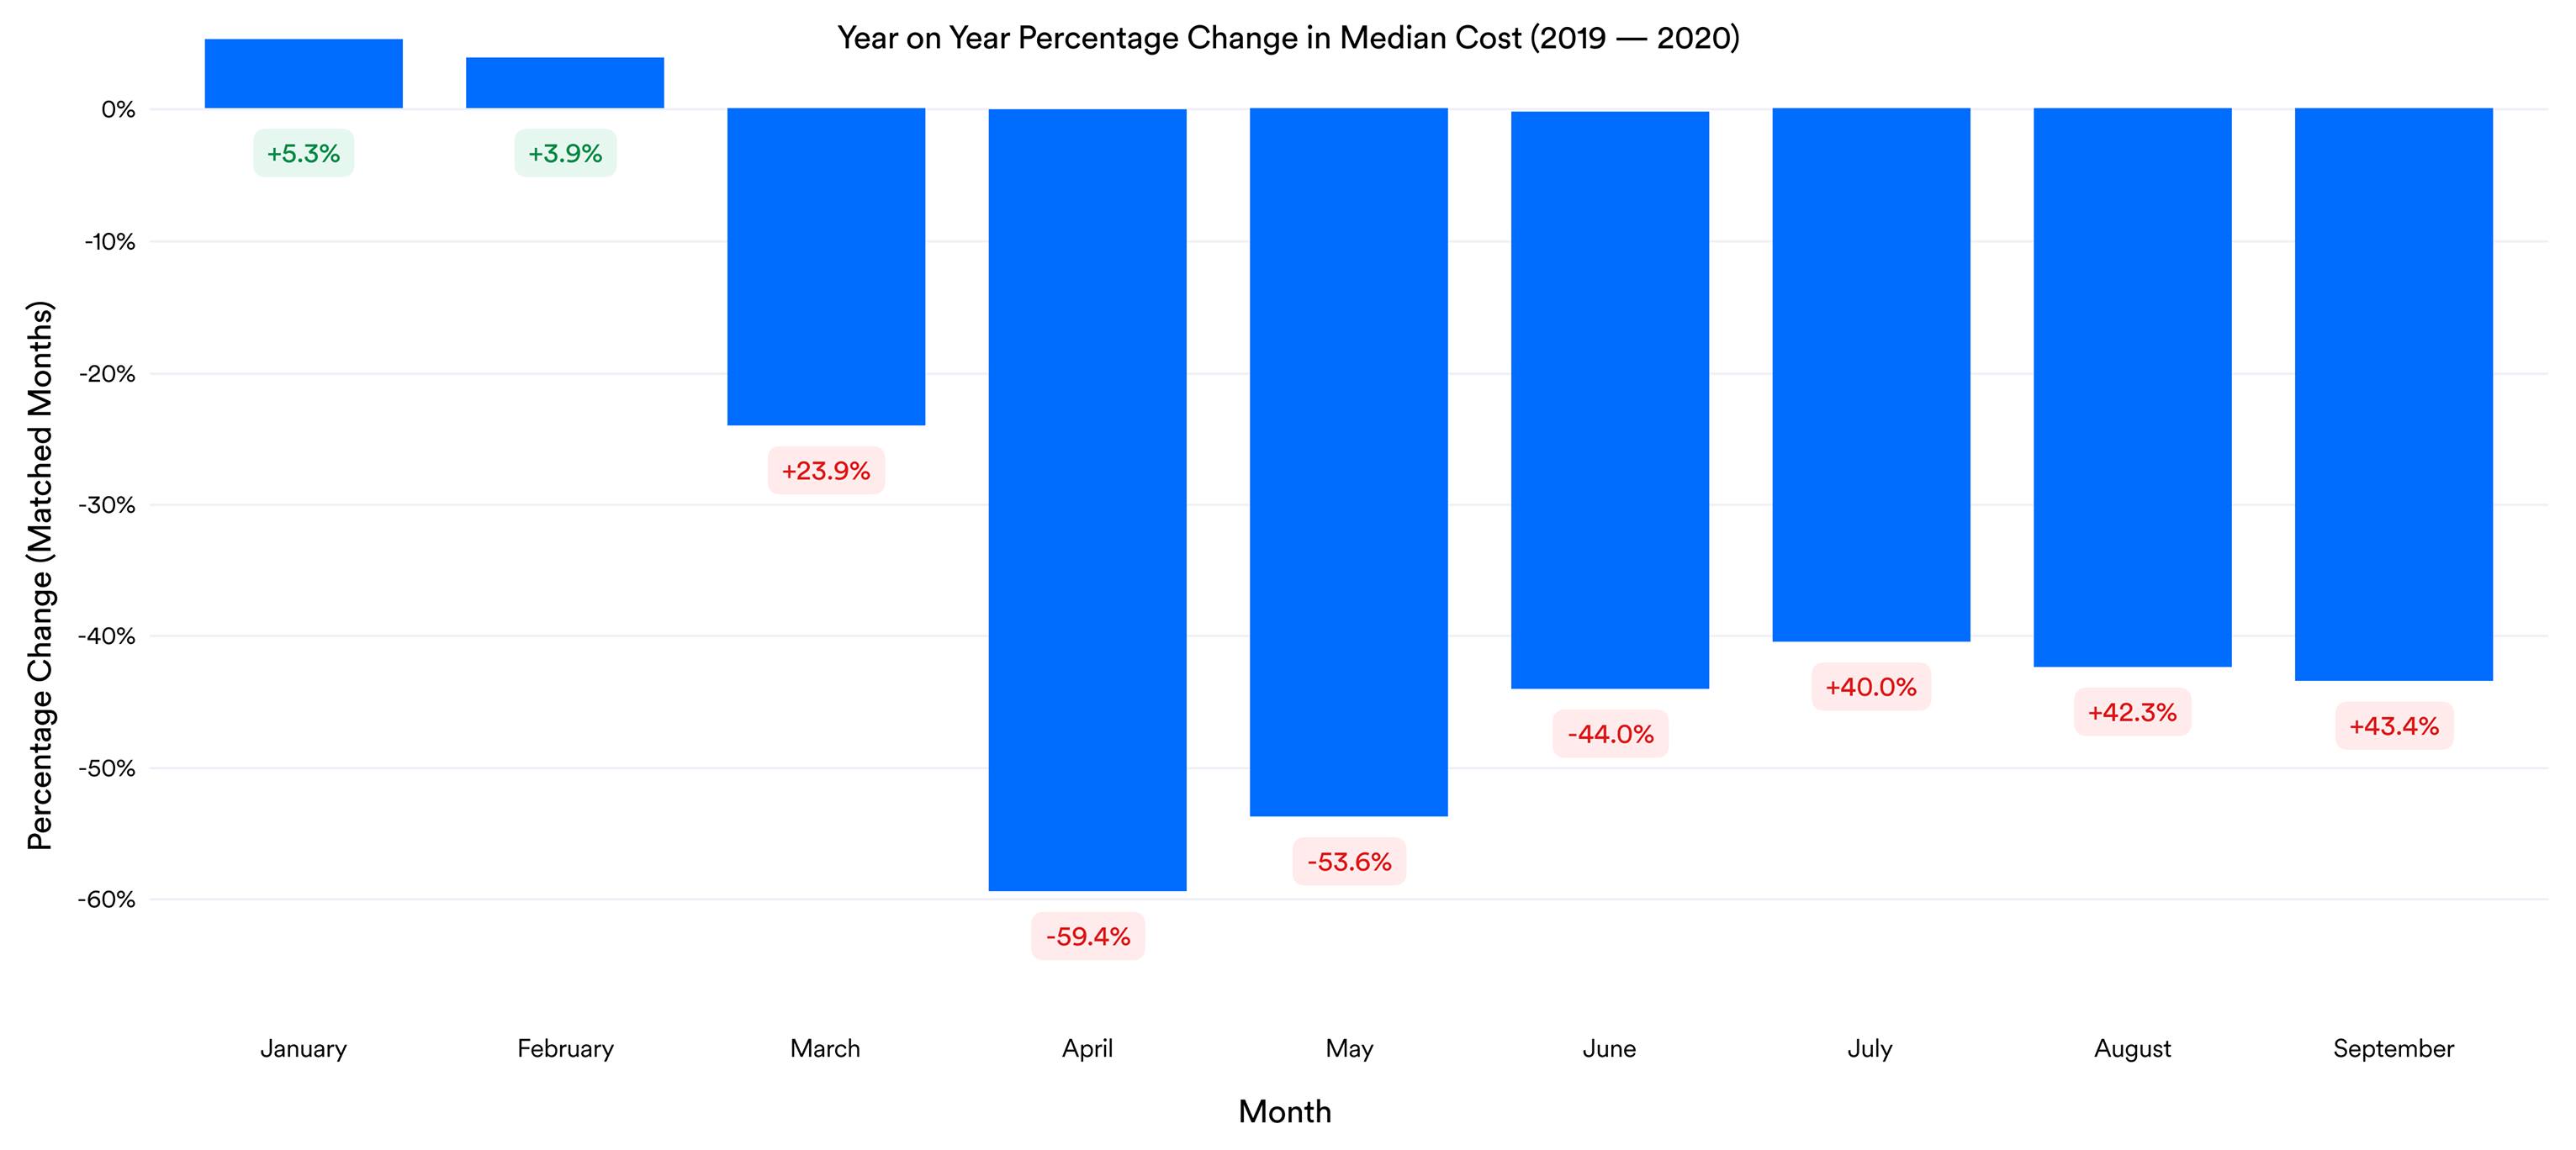
Now the picture looks very different. Spend fell as much as 60% in April, and is still down by more than 40% compared to last year. Impressions and Clicks follow a similar trend.
This suggests there are a few outliers that are inflating the mean. Some accounts have clearly been successful throughout the pandemic, while most have seen KPIs dip.
Spending Trends by Industry & Account Size
We broke the spend down by account size to dig further into these results. In Graph 3 you’ll see that only large accounts, those spending more than £10,000 per month, have been able to increase their spending since June. Impressions and Clicks present a similar story.
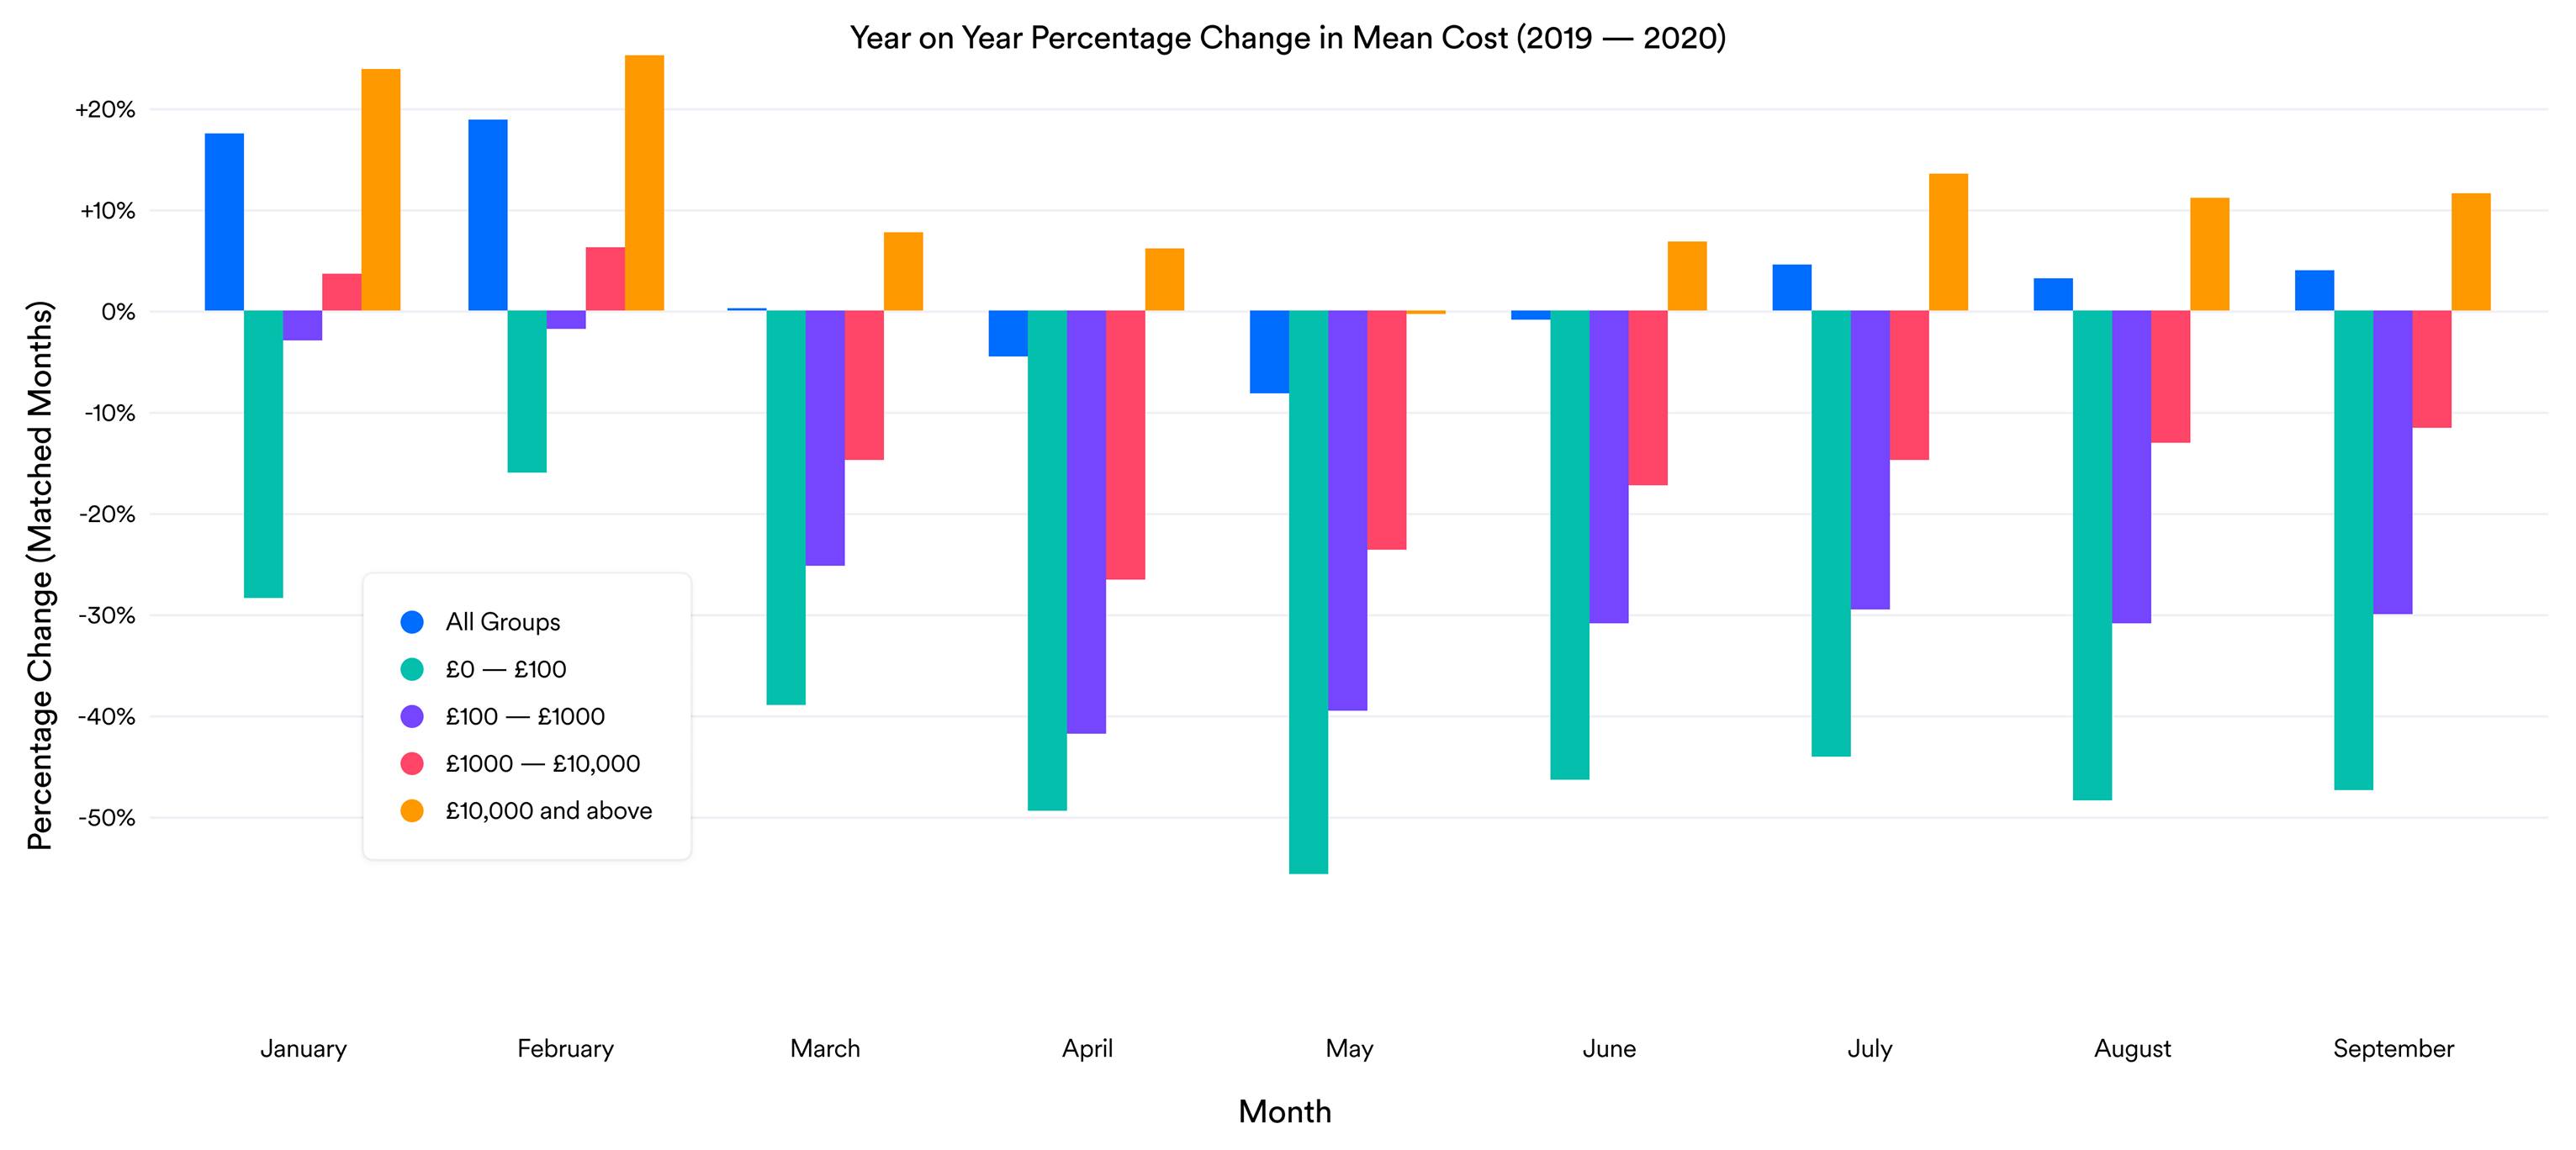
It appears that the auction is being dominated by these big spenders, while smaller accounts have seen their metrics dip. The negative impacts of the pandemic have been felt most by those spending less than £1000 per month on Google Ads.
There are also big differences between Industries. In Graph 4 we can see that Fitness and Beauty, Home and Garden, and Shopping have all increased compared to last year. (For agencies, it may be worth pursuing these types of clients if you don't already work with them!)
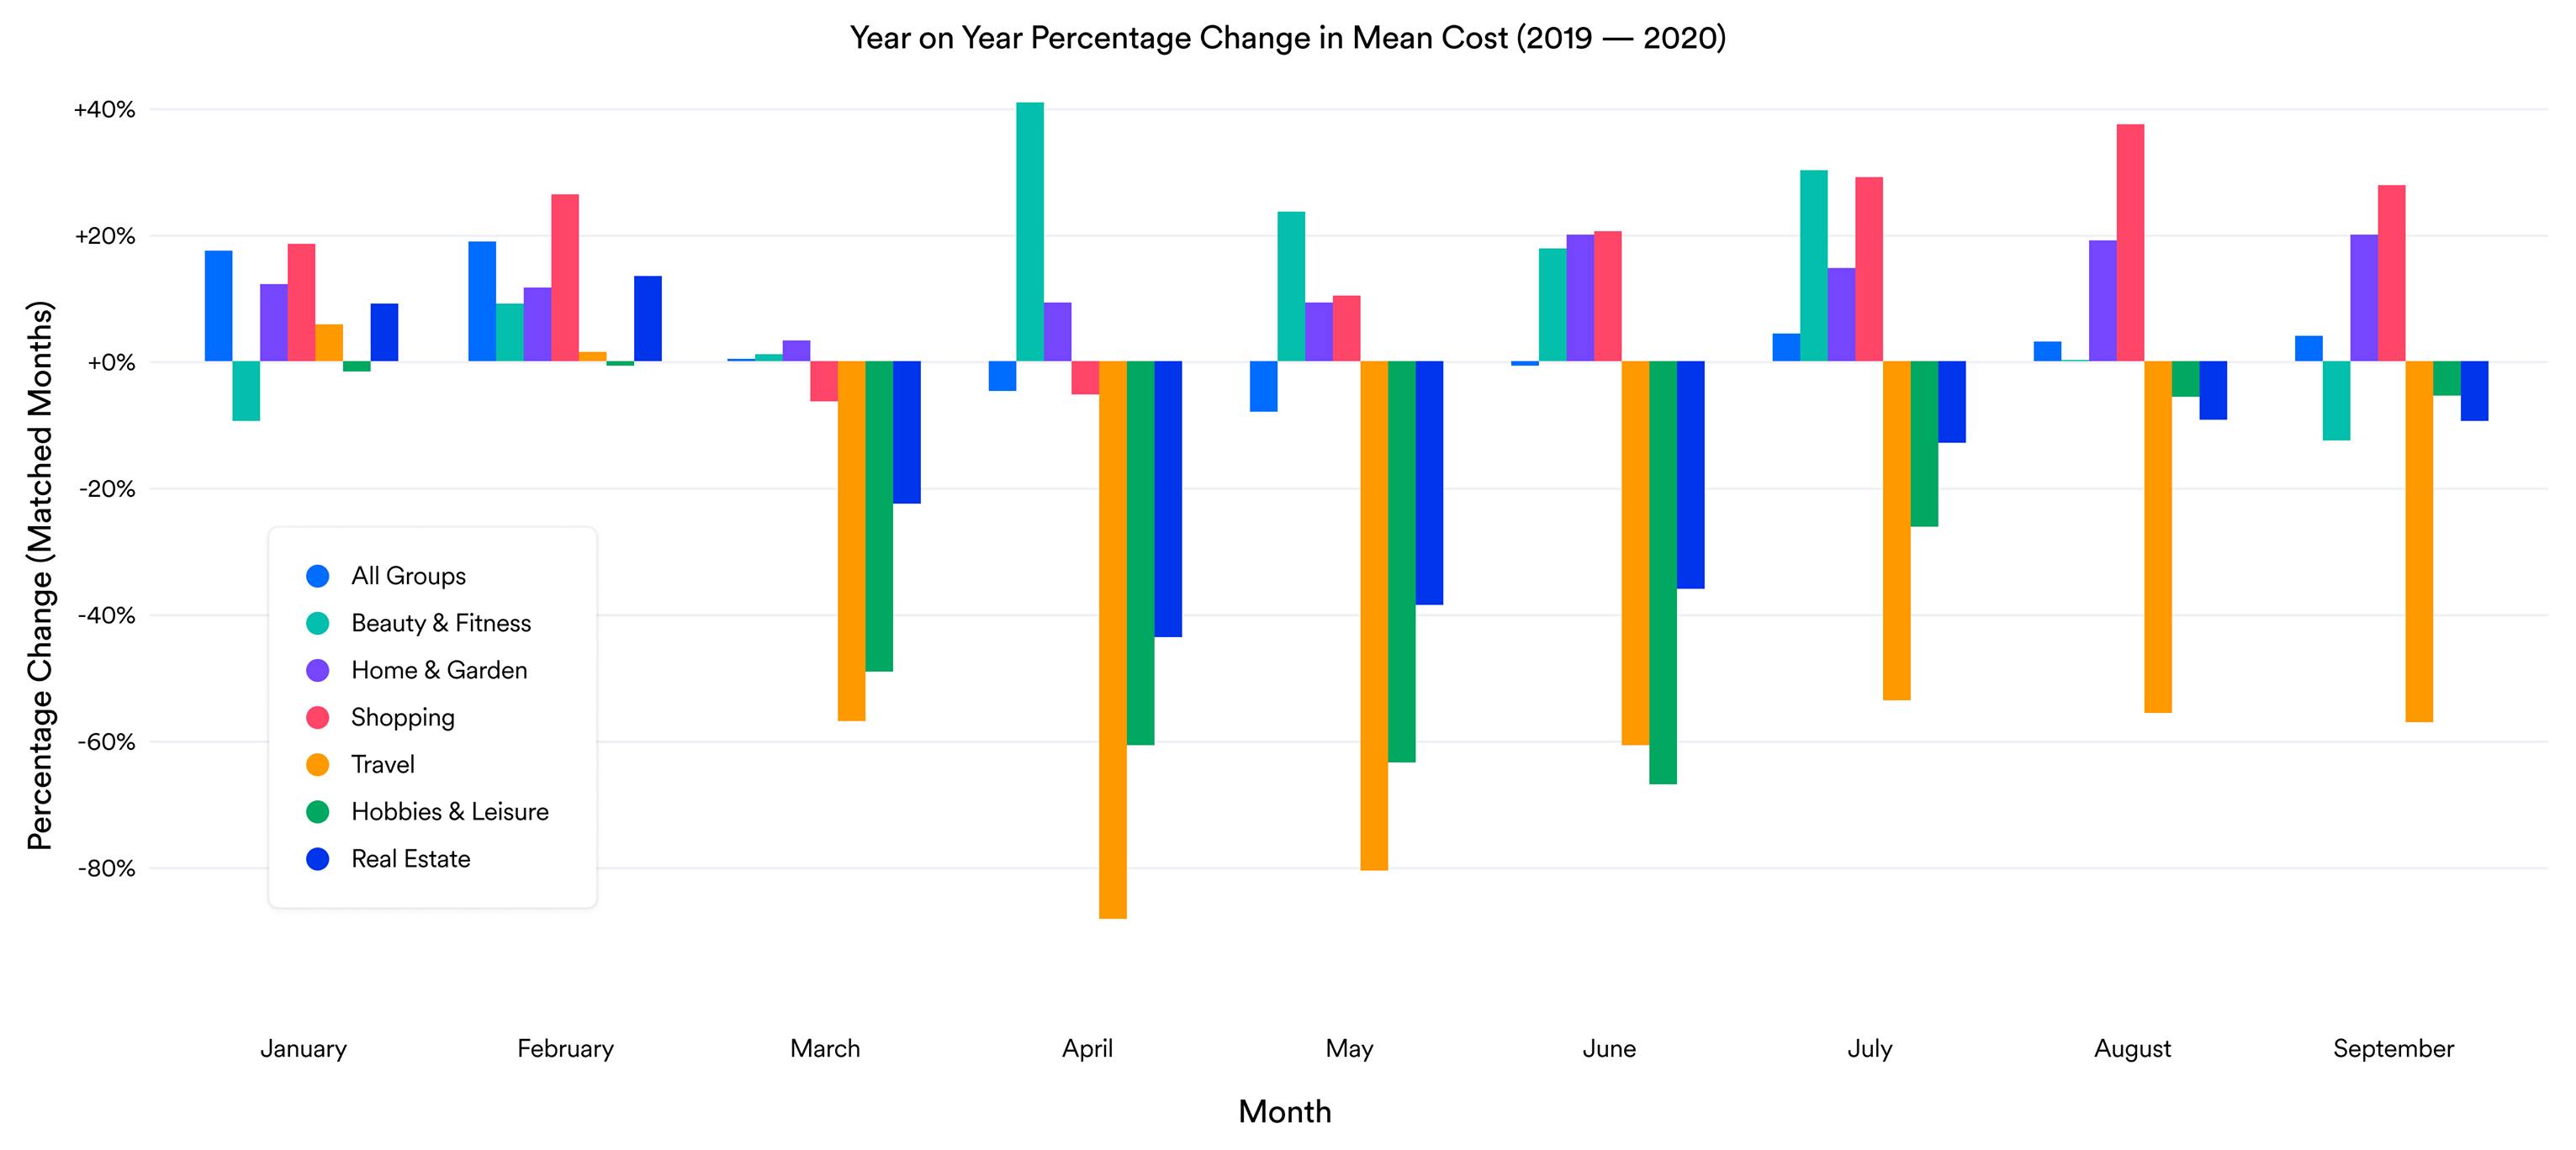
In contrast, Travel, Hobbies and Leisure, and Real Estate have all seen a dip in mean cost.


Related Posts:

